
All three pictures are in capitalism though.
- 3 Posts
- 12 Comments
Joined 3 years ago
Cake day: September 1st, 2023
You are not logged in. If you use a Fediverse account that is able to follow users, you can follow this user.
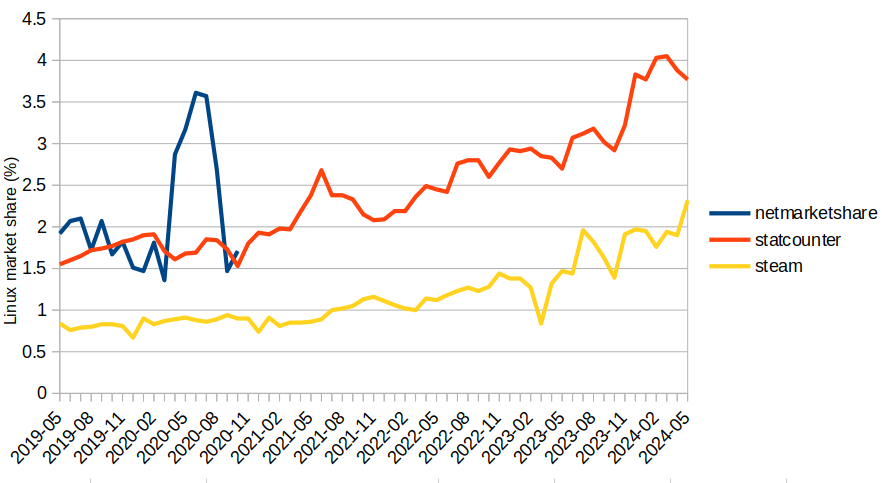
Good point, thanks. The way I modeled the adjustment was by assuming that most usage is captured by Statcounter but there’s movement back and forth to a reservoir that flies under its radar, in bursts, with zero net movement in the long run. So I used a geometric mean of the source data scaled by the square root of their averaged ratio.

deleted by creator
deleted by creator

deleted by creator
deleted by creator
deleted by creator

 2·1 year ago
deleted by creator
deleted by creator
deleted by creator
This content will be automatically deleted

This content will be automatically deleted
This content will be automatically deleted
deleted by creator
deleted by creator
This content will be automatically deleted
There is a theorem that relates wealth distribution and individual risk, so this is a great analogy.